
London
HMCTS region · 10 Crown Court centres · 9 magistrates' local justice areas
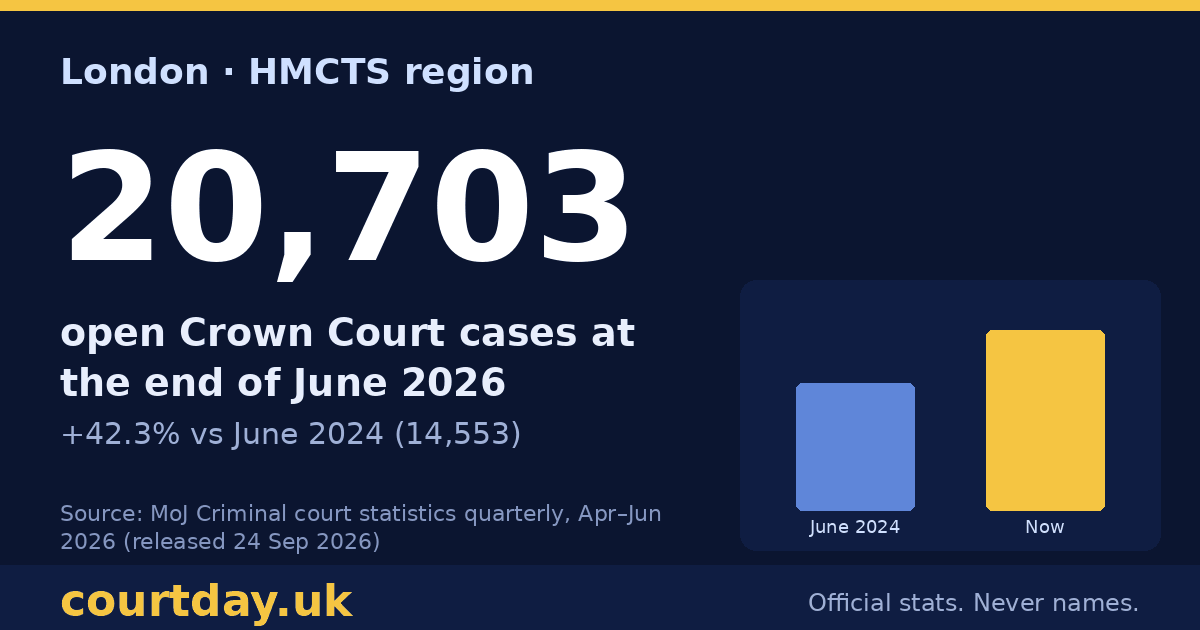
20,703
Open Crown Court cases, end of June 2026
+42.3% vs June 2024 (14,553)
Crown Court centres
Tap the chart for a share image ↗ · figures in the table below
| Court | Open Jun 2024 | Open Jun 2026 | Change |
|---|---|---|---|
| Snaresbrook Crown Court | 3,269 | 4,588 | +40.3% |
| Isleworth Crown Court | 1,797 | 2,799 | +55.8% |
| Wood Green Crown Court | 1,733 | 2,372 | +36.9% |
| Woolwich Crown Court | 1,333 | 2,304 | +72.8% |
| Inner London Sessions House Crown Court | 1,246 | 1,859 | +49.2% |
| Croydon Crown Court | 1,328 | 1,713 | +29.0% |
| Southwark Crown Court | 1,240 | 1,683 | +35.7% |
| Harrow Crown Court | 656 | 1,381 | +110.5% |
| Kingston Upon Thames Crown Court | 961 | 1,248 | +29.9% |
| Central Criminal Court | 988 | 756 | -23.5% |
Region total includes centres listed in the MoJ file without their own page (closed or no June 2026 figure): Blackfriars Crown Court (0 open). The same rule is used on every page.
Magistrates' courts (local justice areas)
Tap the chart for a share image ↗ · figures in the table below
| Court | Open Jun 2024 | Open Jun 2026 | Change |
|---|---|---|---|
| South West London LJA | 12,328 | 10,842 | -12.1% |
| Central London LJA | 5,473 | 10,805 | +97.4% |
| East London LJA | 5,011 | 8,458 | +68.8% |
| North London LJA | 5,560 | 7,174 | +29.0% |
| South East London LJA | 7,171 | 7,025 | -2.0% |
| North West London LJA | 4,934 | 6,805 | +37.9% |
| North East London LJA | 3,870 | 6,071 | +56.9% |
| South London LJA | 2,937 | 5,933 | +102.0% |
| West London LJA | 3,651 | 4,540 | +24.3% |