Scotland ›
Recorded crime in Scotland
Crimes recorded and cleared up by Police Scotland in each of the 32 council areas. Official Scottish Government statistics. Scotland counts crimes differently from England and Wales, so the two are not compared. No individuals.
courtday.uk
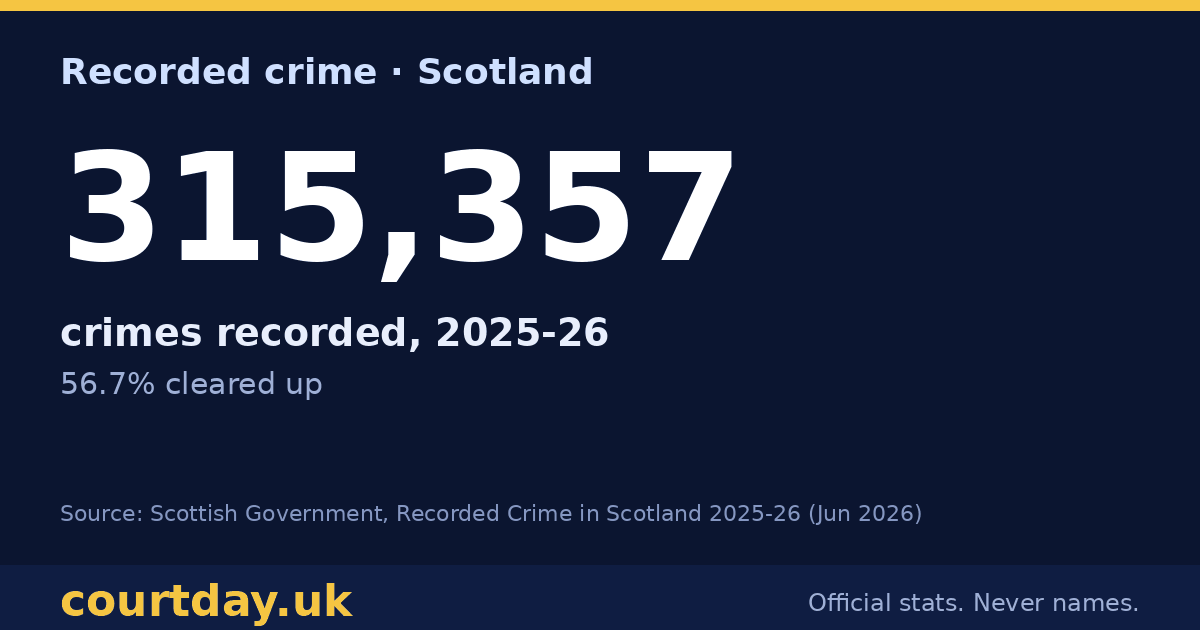
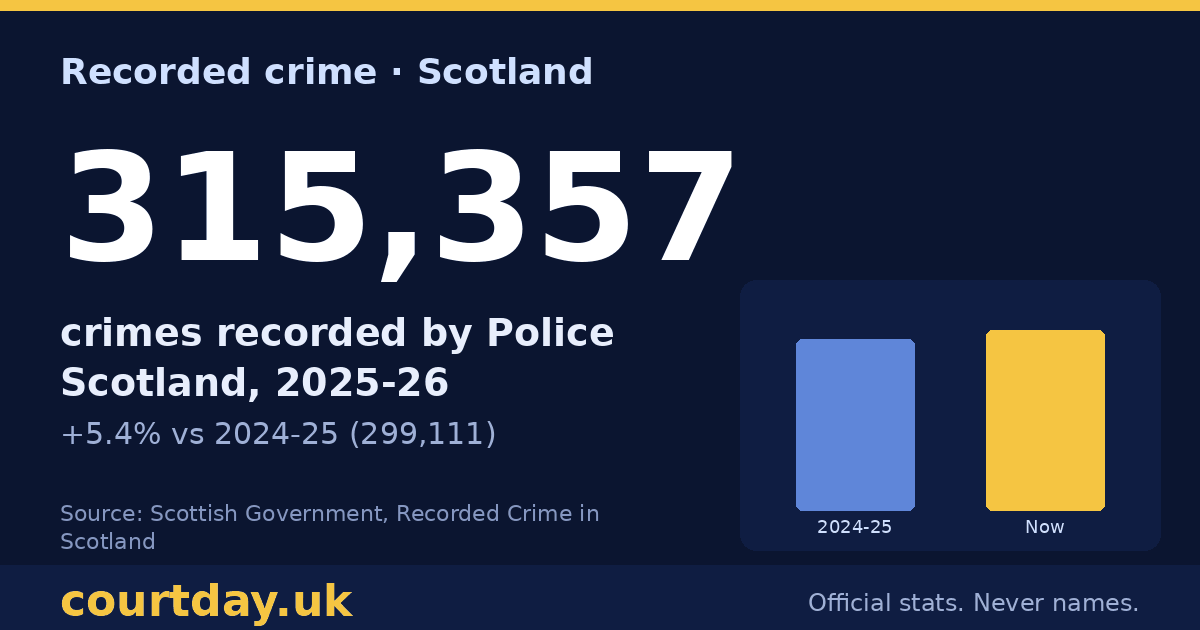
315,357
crimes recorded by Police Scotland, 2025-26
+5.4% vs 2024-25 (299,111)
Source: Recorded Crime in Scotland, 2025-26 — tables (Scottish Government (Justice Analytical Services), published 23 June 2026) · file
courtday.uk
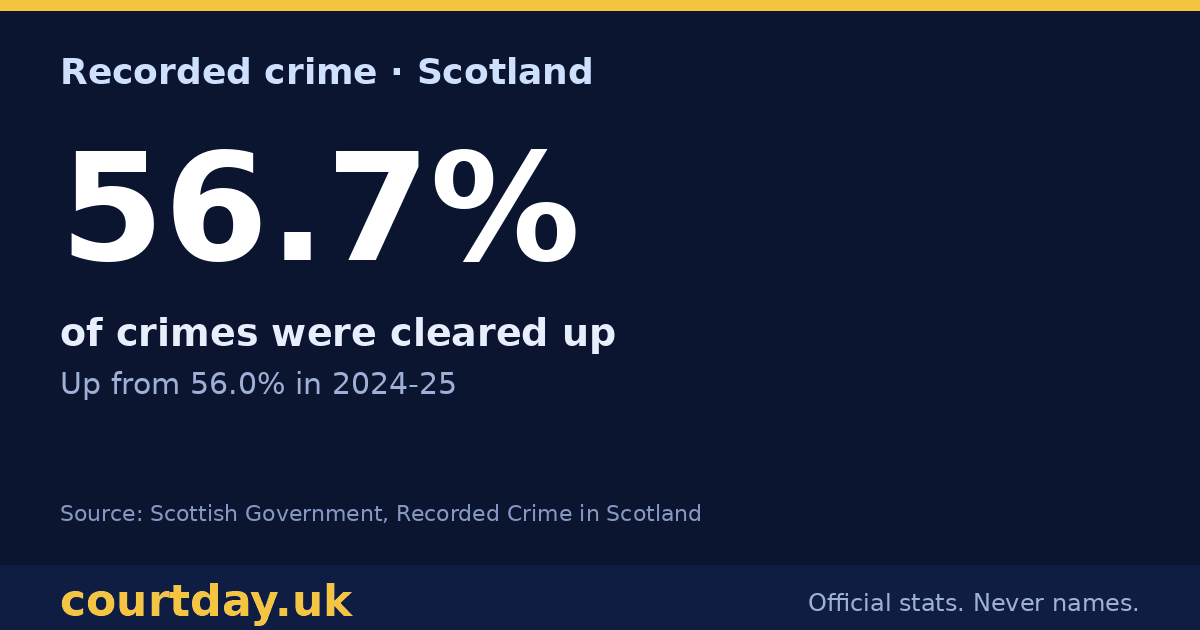
56.7%
of crimes were cleared up
Up from 56.0% in 2024-25
Source: Recorded Crime in Scotland, 2025-26 — tables (Scottish Government (Justice Analytical Services), published 23 June 2026) · file
courtday.uk
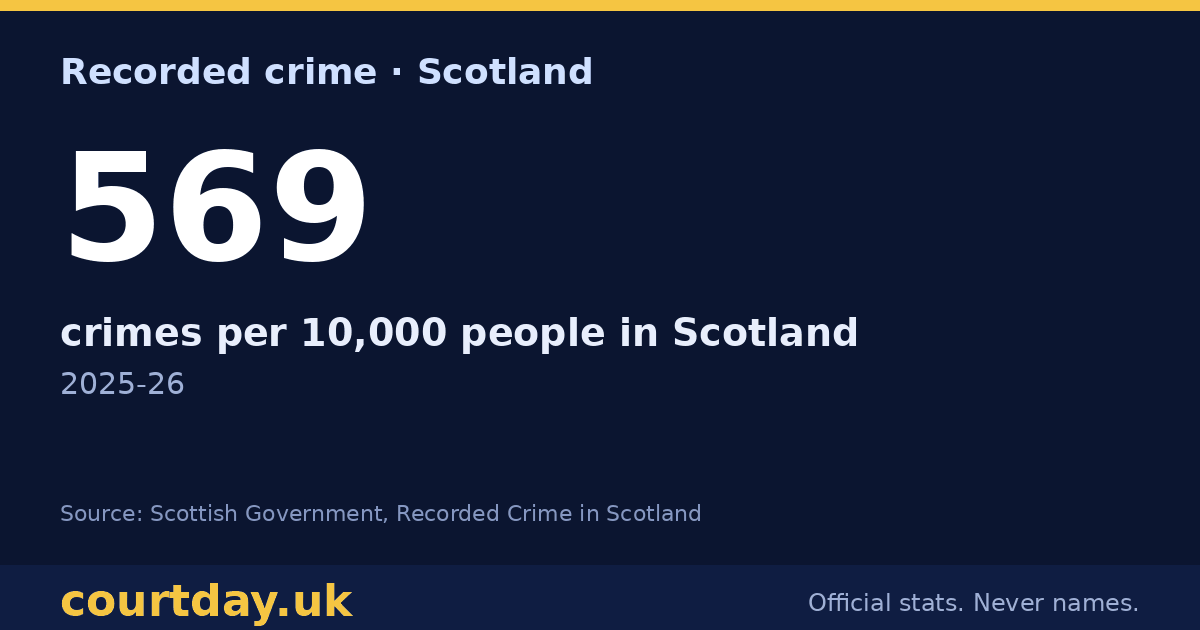
569
crimes per 10,000 people in Scotland
2025-26
Source: Recorded Crime in Scotland, 2025-26 — tables (Scottish Government (Justice Analytical Services), published 23 June 2026) · file
Crimes recorded, 2016-17 to 2025-26
Tap the chart for a share image ↗ · figures in the table below
| Year | Crimes recorded, Scotland |
|---|---|
| 2016-17 | 298,154 |
| 2017-18 | 304,215 |
| 2018-19 | 305,699 |
| 2019-20 | 305,220 |
| 2020-21 | 299,452 |
| 2021-22 | 286,464 |
| 2022-23 | 289,351 |
| 2023-24 | 299,790 |
| 2024-25 | 299,111 |
| 2025-26 | 315,357 |
Source: Recorded Crime in Scotland, 2025-26 — tables (Scottish Government (Justice Analytical Services), published 23 June 2026) · file
By crime group, 2025-26
Tap the chart for a share image ↗ · figures in the table below
| Crime group | 2024-25 | 2025-26 | Change | Cleared up |
|---|---|---|---|---|
| Non-sexual crimes of violence | 71,170 | 75,601 | +6.2% | 68.5% |
| Sexual crimes | 14,892 | 16,430 | +10.3% | 61.2% |
| Crimes of dishonesty | 110,913 | 118,040 | +6.4% | 36.7% |
| Damage and reckless behaviour | 38,738 | 38,166 | -1.5% | 32.5% |
| Crimes against society | 63,398 | 67,120 | +5.9% | 91.5% |
Source: Recorded Crime in Scotland, 2025-26 — tables (Scottish Government (Justice Analytical Services), published 23 June 2026) · file
Every council area
Tap the chart for a share image ↗ · figures in the table below
| Council area | Crimes 2025-26 | Change | Per 10,000 people | Cleared up |
|---|---|---|---|---|
| Glasgow City | 55,193 | +5.3% | 849 | 55.0% |
| Edinburgh, City of | 39,483 | +3.6% | 744 | 43.6% |
| Fife | 20,437 | +8.1% | 545 | 65.6% |
| North Lanarkshire | 20,271 | +4.6% | 588 | 63.0% |
| South Lanarkshire | 16,737 | +3.6% | 501 | 58.8% |
| Aberdeen City | 15,461 | +8.0% | 667 | 58.5% |
| Dundee City | 13,924 | +18.3% | 929 | 52.4% |
| West Lothian | 10,305 | +2.7% | 553 | 48.1% |
| Highland | 10,202 | -0.5% | 430 | 63.0% |
| Renfrewshire | 10,071 | +4.2% | 532 | 59.7% |
| Falkirk | 8,838 | +10.0% | 552 | 56.0% |
| Dumfries & Galloway | 8,058 | +3.7% | 552 | 67.2% |
| Aberdeenshire | 7,787 | +1.5% | 294 | 64.1% |
| North Ayrshire | 7,284 | -4.1% | 544 | 64.5% |
| Perth & Kinross | 6,544 | +7.8% | 424 | 57.4% |
| East Ayrshire | 6,538 | +1.6% | 538 | 62.9% |
| West Dunbartonshire | 6,192 | +6.2% | 695 | 58.4% |
| East Lothian | 5,555 | +16.8% | 482 | 44.3% |
| South Ayrshire | 5,182 | +0.3% | 462 | 63.8% |
| Midlothian | 4,987 | +0.7% | 499 | 47.4% |
| Angus | 4,884 | +4.2% | 425 | 58.2% |
| Scottish Borders | 4,779 | +4.9% | 409 | 54.2% |
| Inverclyde | 4,689 | +16.3% | 594 | 66.2% |
| Stirling | 4,232 | +13.4% | 449 | 55.6% |
| Moray | 4,190 | +5.9% | 441 | 69.3% |
| Argyll & Bute | 3,606 | +3.9% | 411 | 66.3% |
| East Dunbartonshire | 3,075 | +16.4% | 280 | 54.3% |
| Clackmannanshire | 2,706 | +2.3% | 519 | 61.5% |
| East Renfrewshire | 2,524 | -3.0% | 253 | 53.5% |
| Na h-Eileanan Siar | 614 | +7.3% | 236 | 59.8% |
| Orkney Islands | 539 | +4.7% | 245 | 72.5% |
| Shetland Islands | 470 | +13.5% | 203 | 60.6% |
Source: Recorded Crime in Scotland, 2025-26 — tables (Scottish Government (Justice Analytical Services), published 23 June 2026) · file
Clear-up rate = crimes cleared up in the year ÷ crimes recorded in the year. A crime can be cleared up in a later year than it was recorded, so rates can go above 100% for small groups. Rates are per 10,000 people using National Records of Scotland mid-year estimates.
Not published
Crimes recorded by British Transport Police and the Ministry of Defence Police in Scotland are published only as national totals and are not included. Offences (such as minor motoring offences) are counted separately from crimes and are not shown here.