
Birmingham and Solihull LJA
Magistrates' courts (local justice area) · HMCTS region: Midlands · Local criminal justice area: West Midlands LCJB
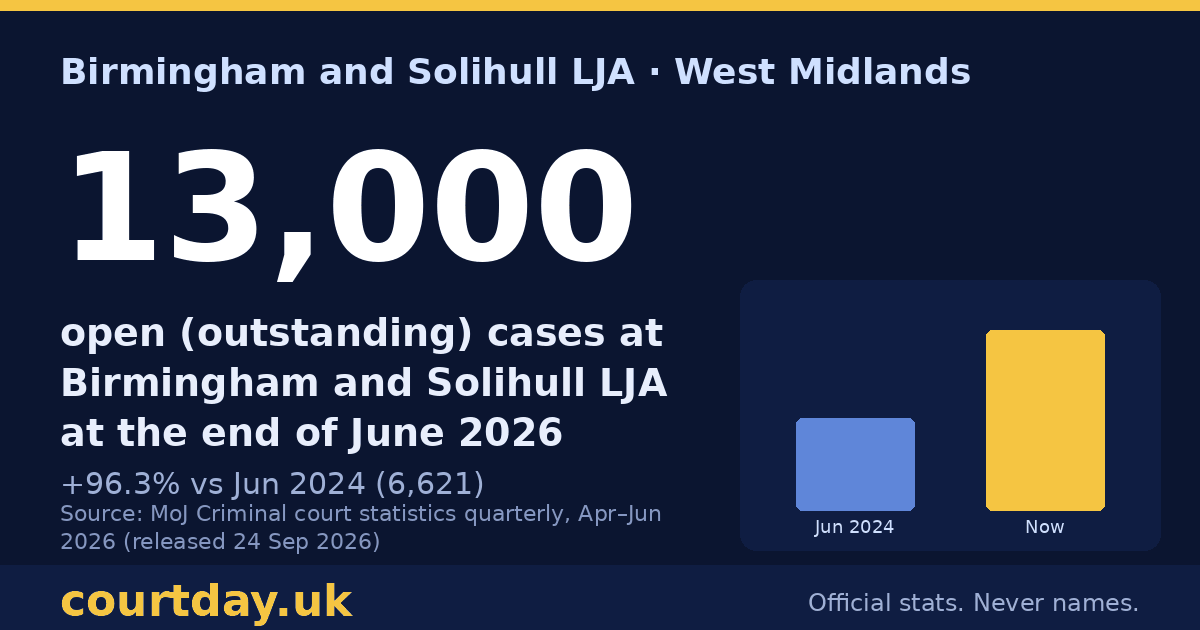
13,000
Open (outstanding) cases, end of June 2026
+96.3% vs Jun 2024 (6,621)
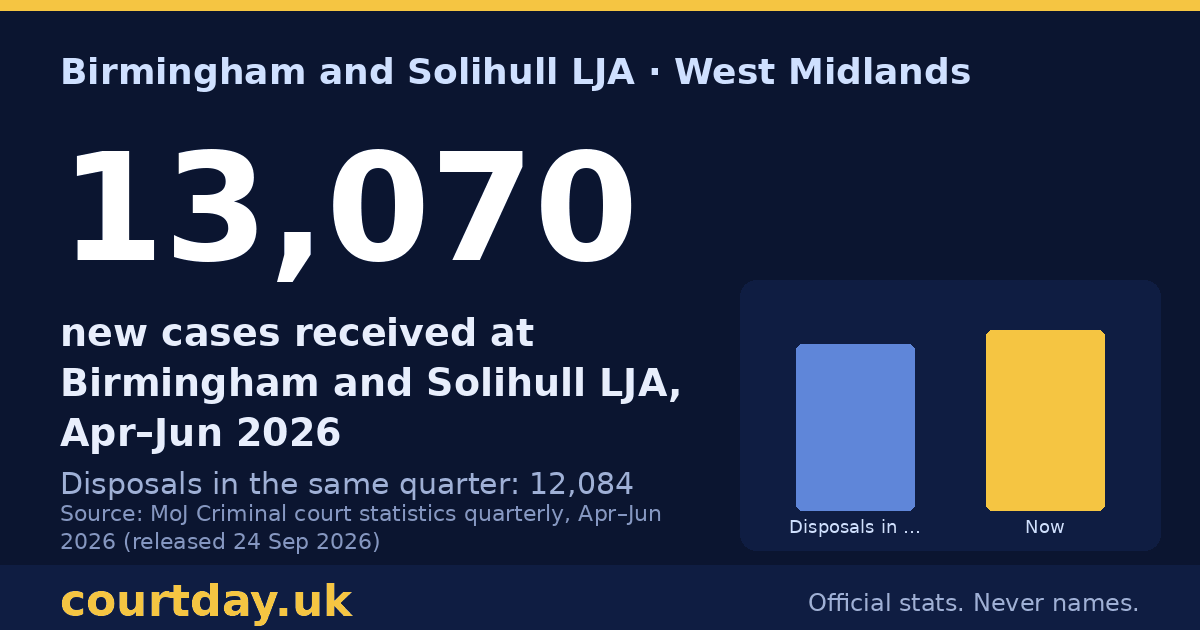
13,070
New cases received, Apr–Jun 2026
Disposals in the same quarter: 12,084
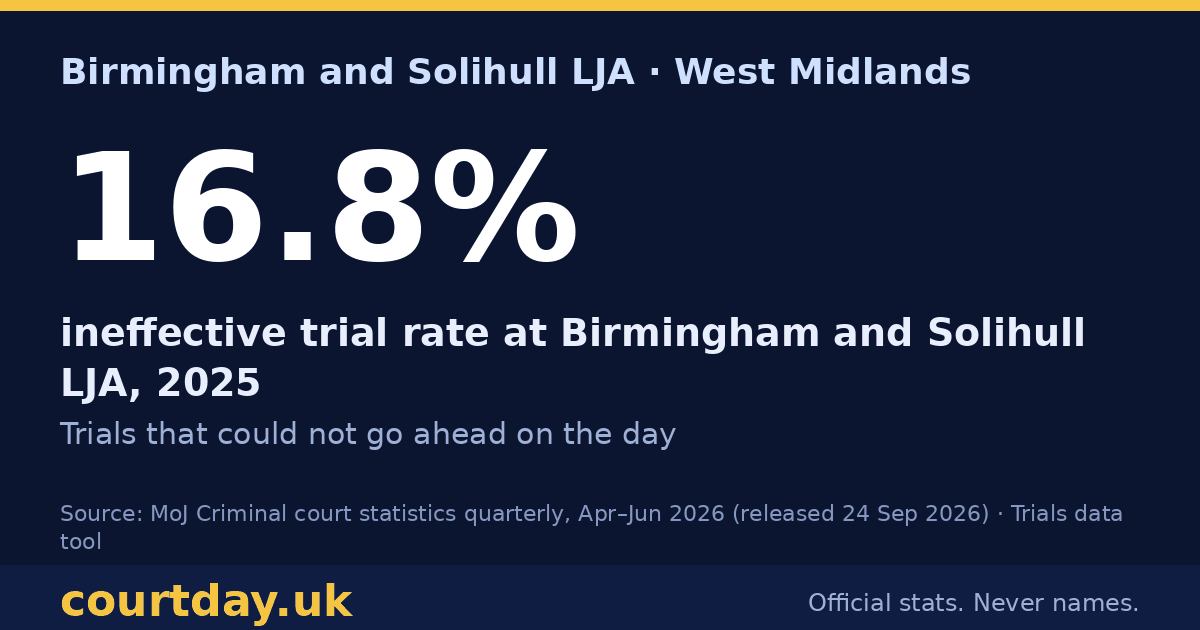
16.8%
Ineffective trial rate, 2025
Trials that couldn't go ahead on the day
About the +96.3% rise. We checked this figure. The MoJ file shows Birmingham and Solihull LJA as the same local justice area in every quarter from 2019 to 2026, with no boundary change or merger in the period (a merger with Black Country LJA has only been proposed in the MoJ Reform of Local Justice Areas consultation). The rise is spread across most case types rather than one category: for example open summary motoring cases (including Single Justice Procedure) went from 2,457 to 5,975 and triable-either-way cases from 1,679 to 3,149 between June 2024 and June 2026. Most of the increase came in two jumps, July–September 2024 and January–June 2026. MoJ does not publish the reason, so Court Day UK reports the published figure without attributing a cause. Source: MoJ Criminal court statistics quarterly, Apr–Jun 2026, mags_rdos_2026Q2.csv.
Caseload, last 2 years (quarterly)
Tap the chart for a share image ↗ · figures in the table below
| Quarter ending | Receipts | Disposals | Open at end |
|---|---|---|---|
| Mar 2024 | 8,559 | 9,244 | 5,491 |
| Jun 2024 | 8,420 | 7,289 | 6,621 |
| Sep 2024 | 11,866 | 9,066 | 9,422 |
| Dec 2024 | 11,685 | 12,588 | 8,518 |
| Mar 2025 | 11,268 | 10,898 | 8,889 |
| Jun 2025 | 10,003 | 9,508 | 9,383 |
| Sep 2025 | 9,281 | 9,069 | 9,595 |
| Dec 2025 | 9,870 | 9,220 | 10,249 |
| Mar 2026 | 11,566 | 9,805 | 12,014 |
| Jun 2026 | 13,070 | 12,084 | 13,000 |
Source: Criminal court statistics quarterly: April to June 2026 — Transparency files (csv) (MoJ, released 24 September 2026) · All case types incl. Single Justice Procedure; figures are for the whole local justice area (MoJ does not publish by individual magistrates' courthouse)
Trials listed
Tap the chart for a share image ↗ · figures in the table below
| Period | Effective | Cracked | Ineffective | Vacated | Ineffective rate |
|---|---|---|---|---|---|
| 2024 | 858 | 912 | 398 | 687 | 18.4% |
| 2025 | 1,177 | 1,277 | 494 | 729 | 16.8% |
| Jan–Jun 2026 | 880 | 948 | 351 | 369 | 16.1% |
Source: Criminal court statistics quarterly: April to June 2026 — Transparency files (csv) (MoJ, released 24 September 2026) · Trials data tool (trials_2026Q2.csv). Ineffective rate = ineffective ÷ (effective + cracked + ineffective), MoJ definition; vacated trials excluded.
Waiting times and pleas (West Midlands LCJB, area level)
MoJ publishes these for the local criminal justice area, not for each court.
| Measure | Earliest | Latest |
|---|---|---|
| Magistrates: median days, charge to completion (excl. SJP, year) | 38 days (2024) | 51 days (2025) |
Source: Criminal court statistics quarterly: April to June 2026 — Transparency files (csv) (MoJ, released 24 September 2026) · Crown Court open-case age, timeliness and plea-rate data tools; magistrates’ timeliness data tool
Not published at court level
- Convictions, sentence types and custody rates for this court — see national figures on Sentencing and Search
- Court address and opening times — see GOV.UK Find a court or tribunal
- Individual cases, hearings or names — never shown on Court Day UK
Embed this court card
Copy this code to show Birmingham and Solihull LJA's latest backlog and trend on your own site. It updates each time Court Day UK updates.
Updates for this court: Atom feed · release-day alerts · compare with another court