
Midlands
HMCTS region · 12 Crown Court centres · 14 magistrates' local justice areas
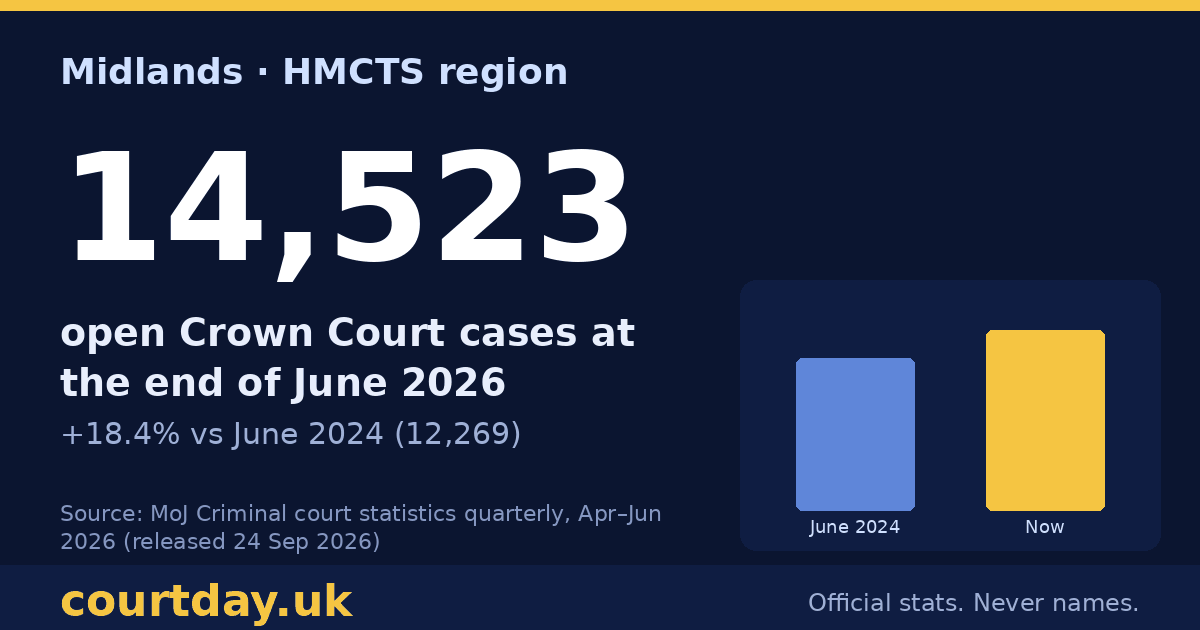
14,523
Open Crown Court cases, end of June 2026
+18.4% vs June 2024 (12,269)
Crown Court centres
Tap the chart for a share image ↗ · figures in the table below
| Court | Open Jun 2024 | Open Jun 2026 | Change |
|---|---|---|---|
| Birmingham Crown Court | 1,856 | 2,574 | +38.7% |
| Nottingham Crown Court | 1,958 | 1,876 | -4.2% |
| Wolverhampton Crown Court | 1,256 | 1,871 | +49.0% |
| Leicester Crown Court | 1,243 | 1,427 | +14.8% |
| Warwick Crown Court | 956 | 1,118 | +16.9% |
| Derby Crown Court | 910 | 1,051 | +15.5% |
| Northampton Crown Court | 823 | 899 | +9.2% |
| Stafford Crown Court | 690 | 899 | +30.3% |
| Worcester Crown Court | 818 | 815 | -0.4% |
| Shrewsbury Crown Court | 640 | 779 | +21.7% |
| Stoke On Trent Crown Court | 608 | 757 | +24.5% |
| Lincoln Crown Court | 511 | 457 | -10.6% |
Magistrates' courts (local justice areas)
Tap the chart for a share image ↗ · figures in the table below
| Court | Open Jun 2024 | Open Jun 2026 | Change |
|---|---|---|---|
| Birmingham and Solihull LJA | 6,621 | 13,000 | +96.3% |
| Worcestershire LJA | 3,881 | 5,830 | +50.2% |
| Lincolnshire LJA | 3,246 | 5,782 | +78.1% |
| Staffordshire LJA | 6,869 | 5,279 | -23.1% |
| Northamptonshire LJA | 2,325 | 4,594 | +97.6% |
| Black Country LJA | 2,424 | 4,529 | +86.8% |
| Nottinghamshire LJA | 6,403 | 3,986 | -37.7% |
| Leicestershire and Rutland LJA | 5,128 | 3,129 | -39.0% |
| Southern Derbyshire LJA | 3,322 | 2,977 | -10.4% |
| Shropshire LJA | 1,192 | 2,091 | +75.4% |
| Coventry and Warwickshire (Coventry) LJA | 1,582 | 1,905 | +20.4% |
| Coventry and Warwickshire (Warwickshire) LJA | 2,036 | 1,790 | -12.1% |
| Herefordshire LJA | 680 | 1,058 | +55.6% |
| Northern Derbyshire LJA | 572 | 841 | +47.0% |
Birmingham and Solihull LJA: the two-year rise has been checked; see the note on its court page.