City of London Police: crime to court
Follow the official figures for this police force area from recorded crime, to police outcome, to court, to reoffending. Official aggregate statistics only. No individuals.
courtday.uk
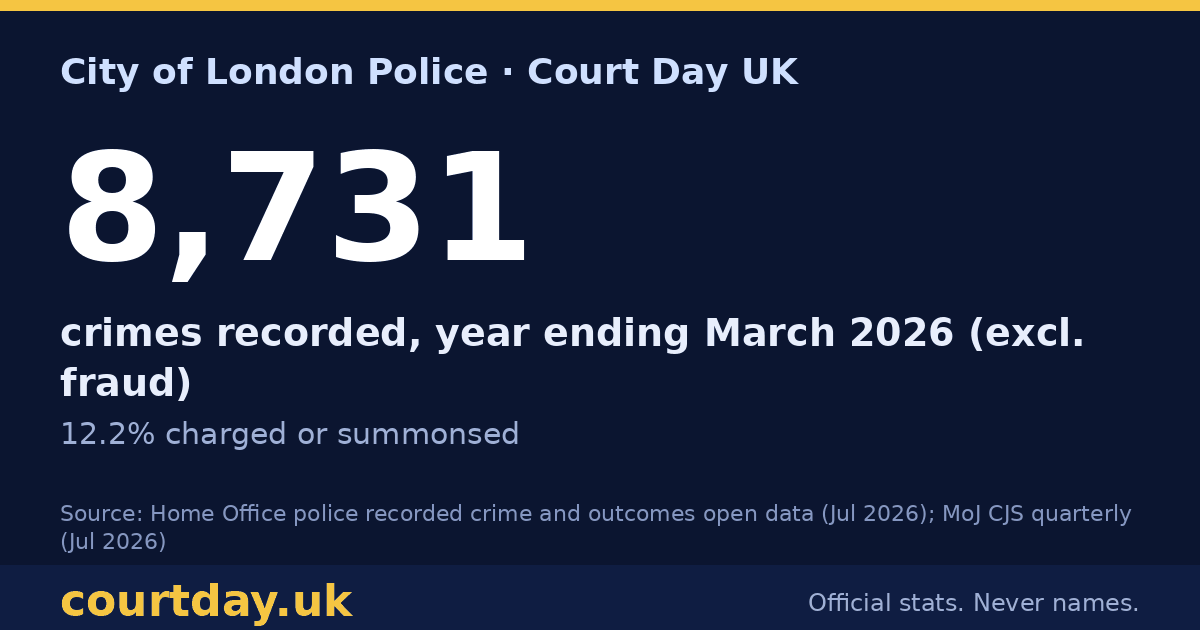
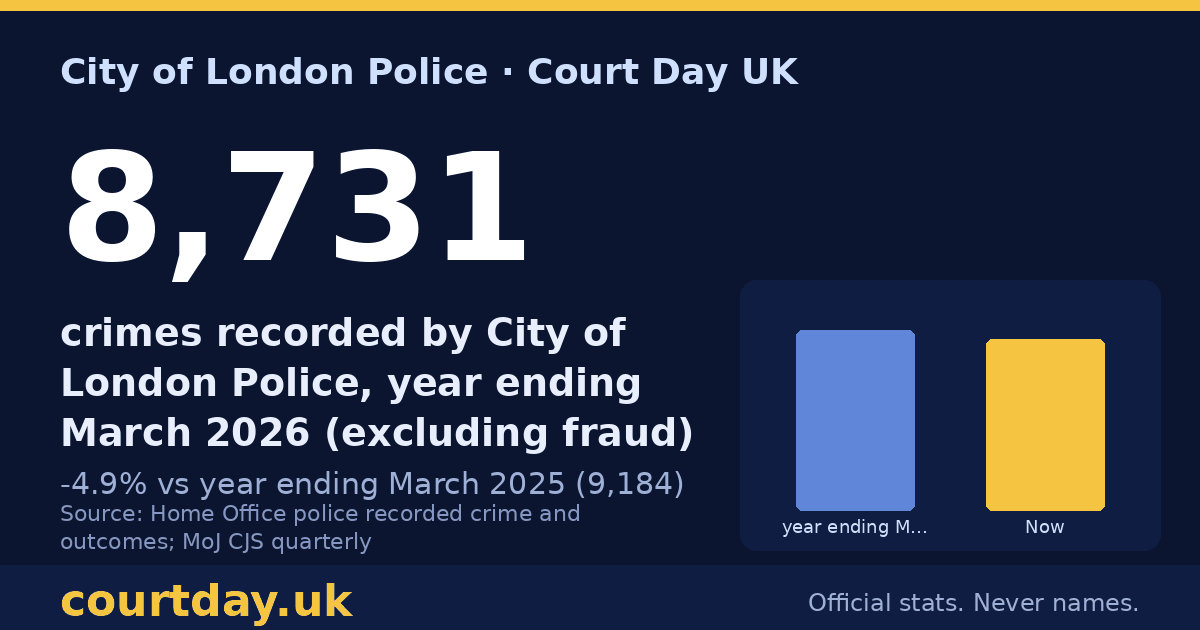
8,731
crimes recorded by City of London Police, year ending March 2026 (excluding fraud)
-4.9% vs year ending March 2025 (9,184)
Source: Police recorded crime open data Police Force Area tables, year ending March 2013 onwards (Home Office, published 23 July 2026) · file
courtday.uk
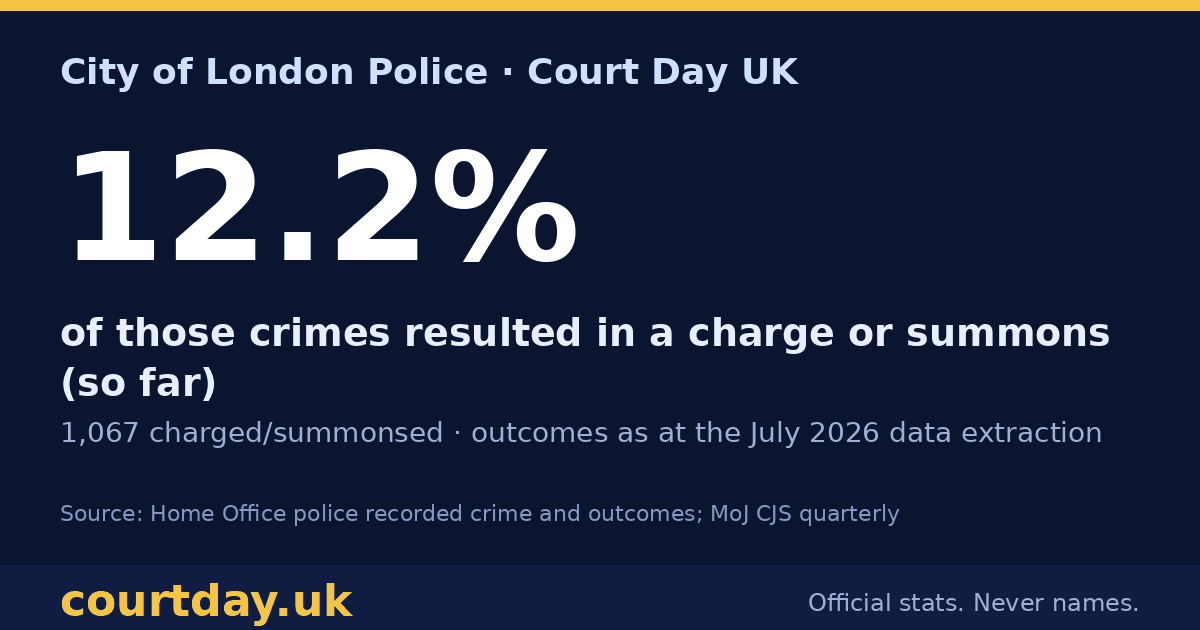
12.2%
of those crimes resulted in a charge or summons (so far)
1,067 charged/summonsed · outcomes as at the July 2026 data extraction
Source: Outcomes open data, year ending March 2026 (Home Office, published 23 July 2026) · file
courtday.uk
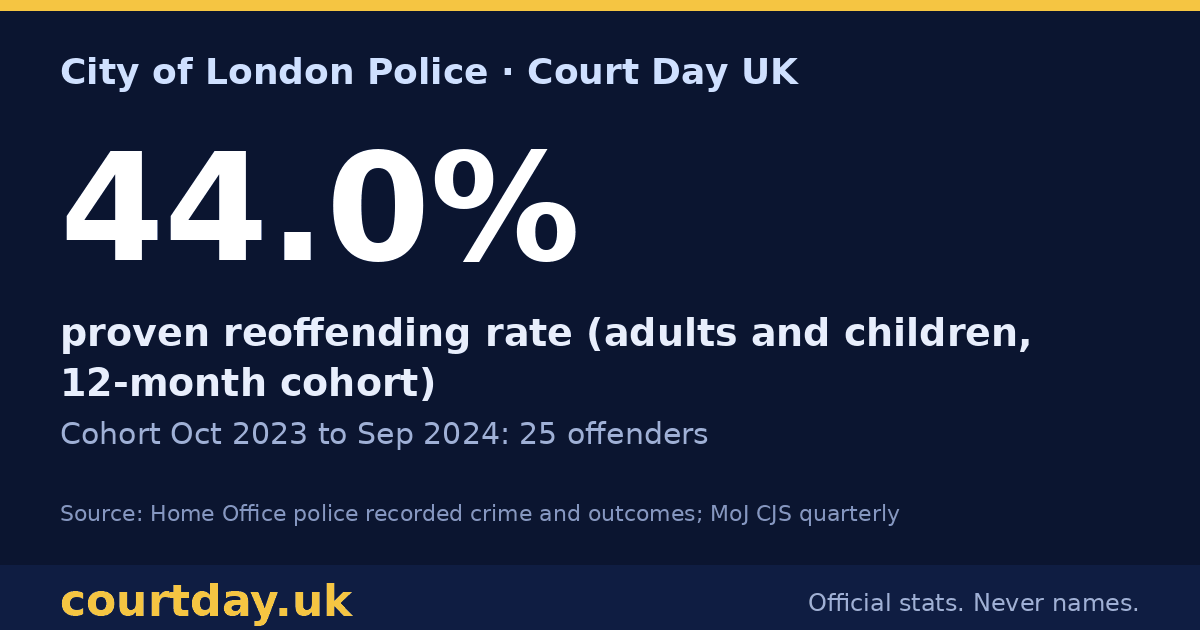
44.0%
proven reoffending rate (adults and children, 12-month cohort)
Cohort Oct 2023 to Sep 2024: 25 offenders
Source: Proven reoffending statistics: July to September 2024 — geographical data (CSV) (Ministry of Justice, published 30 July 2026) · file · 12-month cohort from the geographical data tool
1. Crime recorded by the police
Tap the chart for a share image ↗ · figures in the table below
| Offence group | YE March 2025 | YE March 2026 | Change |
|---|---|---|---|
| Theft offences | 5,502 | 5,280 | -4.0% |
| Violence against the person | 1,436 | 1,355 | -5.6% |
| Public order offences | 697 | 644 | -7.6% |
| Drug offences | 576 | 565 | -1.9% |
| Criminal damage and arson | 373 | 308 | -17.4% |
| Robbery | 161 | 250 | +55.3% |
| Sexual offences | 202 | 149 | -26.2% |
| Miscellaneous crimes against society | 161 | 122 | -24.2% |
| Possession of weapons offences | 76 | 58 | -23.7% |
Source: Police recorded crime open data Police Force Area tables, year ending March 2013 onwards (Home Office, published 23 July 2026) · file · Financial years April to March. Fraud is recorded centrally by Action Fraud and is excluded.
2. What happened to those crimes
Tap the chart for a share image ↗ · figures in the table below
| Police outcome (Home Office group) | Crimes | Share |
|---|---|---|
| Investigation complete – no suspect identified | 4,660 | 53.4% |
| Evidential difficulties (victim does not support action) | 1,291 | 14.8% |
| Charged/Summonsed | 1,067 | 12.2% |
| Evidential difficulties (suspect identified; victim supports action) | 687 | 7.9% |
| Not yet assigned an outcome | 621 | 7.1% |
| Out-of-court (informal) | 237 | 2.7% |
| Prosecution prevented or not in the public interest | 56 | 0.6% |
| Further investigation to support formal action not in the public interest – police decision | 45 | 0.5% |
| Out-of-court (formal) | 31 | 0.4% |
| Diversionary, educational or intervention activity, resulting from the crime report, has been undertaken and it is not in the public interest to take any further action. | 27 | 0.3% |
| Responsibility for further investigation transferred to another body | 9 | 0.1% |
Source: Outcomes open data, year ending March 2026 (Home Office, published 23 July 2026) · file · Outcomes assigned to crimes recorded in year ending March 2026, as at the time of extraction. More charges are added as investigations finish.
3. In court
MoJ publishes court outcomes for this area combined with another force area (City of London is included with the Metropolitan Police; British Transport Police cases fall under the area where they were heard).
Source: Criminal Justice Statistics quarterly: March 2026 — Outcomes by Offence (csv) (MoJ, published 30 July 2026)
4. Reoffending
| Group | Offenders in cohort | Reoffended | Rate |
|---|---|---|---|
| Adult | 25 | 11 | 44.0% |
Source: Proven reoffending statistics: July to September 2024 — geographical data (CSV) (Ministry of Justice, published 30 July 2026) · file · Cohort Oct 2023 to Sep 2024. Proven reoffending within one year (plus six months for court processing).
Latest month: August 2026
Tap the chart for a share image ↗ · figures in the table below
| Crime type (police.uk) | August 2026 | Share |
|---|---|---|
| Other theft | 191 | 24.3% |
| Theft from the person | 133 | 16.9% |
| Violence and sexual offences | 118 | 15.0% |
| Shoplifting | 99 | 12.6% |
| Public order | 60 | 7.6% |
| Burglary | 55 | 7.0% |
| Bicycle theft | 43 | 5.5% |
| Robbery | 30 | 3.8% |
| Drugs | 23 | 2.9% |
| Criminal damage and arson | 14 | 1.8% |
| Vehicle crime | 8 | 1.0% |
| Other crime | 7 | 0.9% |
| Possession of weapons | 4 | 0.5% |
Also 8 anti-social behaviour incidents, which are not recorded crimes.
Source: data.police.uk street-level crime and outcomes, August 2026 (Home Office / police forces (data.police.uk), monthly archive 2026-08) · file · Street-level records counted by category; anti-social behaviour shown separately. Outcome counts below relate to crimes from earlier months updated in this month.
Tap the chart for a share image ↗ · figures in the table below
| Outcome updated in August 2026 | Count |
|---|---|
| Investigation complete; no suspect identified | 400 |
| Unable to prosecute suspect | 150 |
| Suspect charged | 90 |
| Local resolution | 12 |
| Formal action is not in the public interest | 6 |
| Offender given a caution | 3 |
See also: all police forces · prisons · reoffending · courts & regions · find your court