Reoffending
Share of people cautioned, convicted or released from prison who were proven to reoffend within a year, by police force area. Official MoJ statistics.
courtday.uk
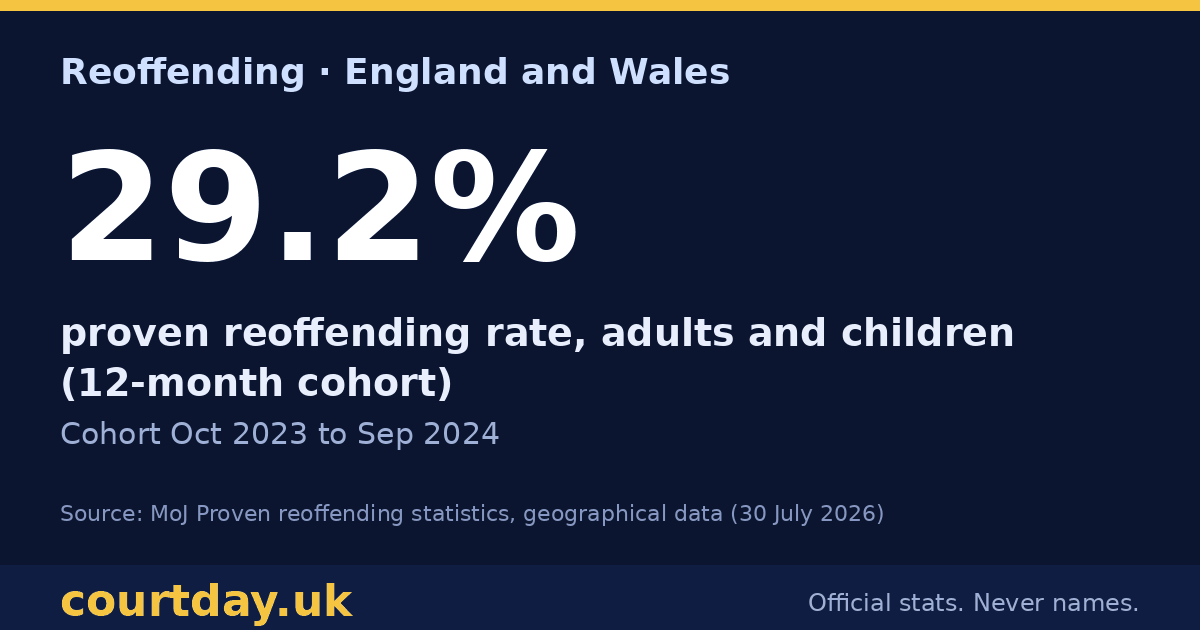
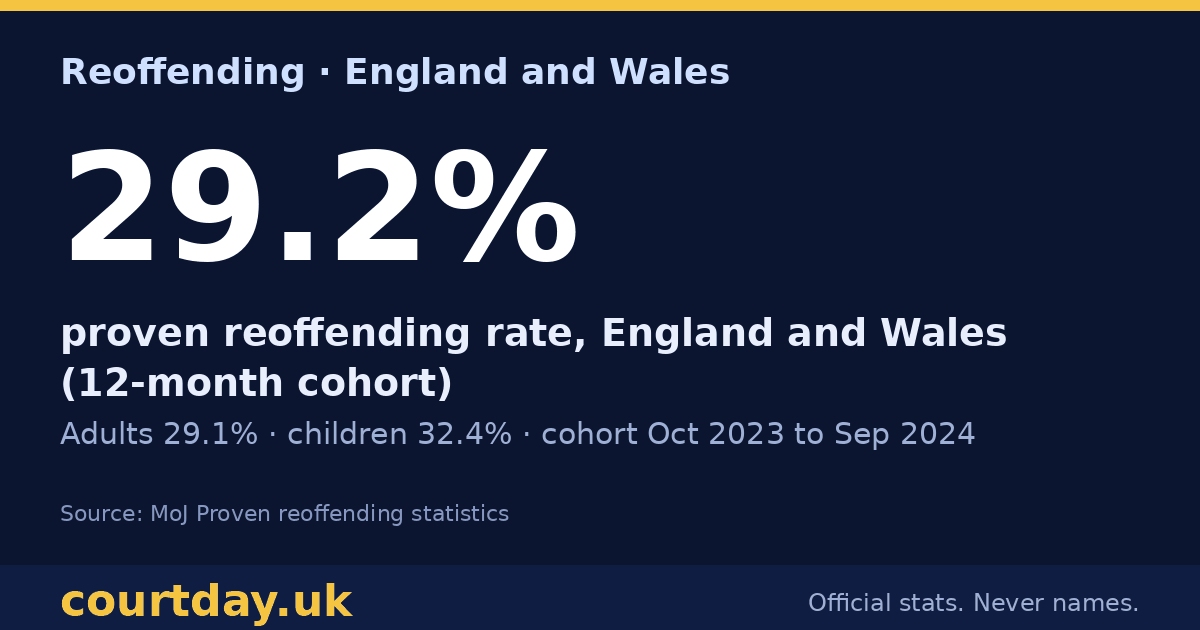
29.2%
proven reoffending rate, England and Wales (12-month cohort)
Adults 29.1% · children 32.4% · cohort Oct 2023 to Sep 2024
Source: Proven reoffending statistics: July to September 2024 — geographical data (CSV) (Ministry of Justice, published 30 July 2026) · file · 12-month cohort. The quarterly headline in the MoJ bulletin uses a 3-month cohort, so it differs slightly.
By police force area
Tap the chart for a share image ↗ · figures in the table below
Not published (suppressed or caveated, not charted): City of London Police
| Police force area | Adult offenders | Adult rate | Child rate | Overall |
|---|---|---|---|---|
| City of London Police | 25 | 44.0% | – | 44.0% (small: 25 people) |
| Cleveland Police | 5,430 | 38.8% | 53.1% | 39.4% |
| Cumbria Constabulary | 3,146 | 35.9% | 37.2% | 35.9% |
| West Yorkshire Police | 17,496 | 35.0% | 31.3% | 34.8% |
| Northumbria Police | 9,615 | 34.4% | 35.7% | 34.4% |
| Durham Constabulary | 4,821 | 33.7% | 42.6% | 34.2% |
| South Yorkshire Police | 9,787 | 34.1% | 32.6% | 34.0% |
| South Wales Police | 8,709 | 33.6% | 30.5% | 33.5% |
| Humberside Police | 6,826 | 32.4% | 45.5% | 32.9% |
| Nottinghamshire Police | 7,861 | 32.0% | 33.2% | 32.0% |
| North Wales Police | 4,834 | 31.8% | 35.6% | 32.0% |
| Merseyside Police | 13,209 | 31.4% | 34.0% | 31.5% |
| Leicestershire Police | 5,930 | 31.0% | 35.1% | 31.1% |
| Lancashire Constabulary | 10,915 | 30.5% | 40.5% | 30.9% |
| North Yorkshire Police | 3,570 | 30.4% | 34.5% | 30.6% |
| Northamptonshire Police | 4,968 | 30.2% | 37.7% | 30.4% |
| Norfolk Constabulary | 6,037 | 29.9% | 34.4% | 30.1% |
| Derbyshire Constabulary | 6,190 | 29.7% | 40.8% | 30.0% |
| Cambridgeshire Constabulary | 4,694 | 29.7% | 34.0% | 29.9% |
| Lincolnshire Police | 3,979 | 29.6% | 31.1% | 29.6% |
| Cheshire Constabulary | 7,020 | 29.3% | 30.4% | 29.3% |
| Devon & Cornwall Police | 7,720 | 29.0% | 25.2% | 28.8% |
| Hampshire Constabulary | 9,138 | 28.0% | 38.8% | 28.5% |
| Greater Manchester Police | 21,552 | 28.0% | 26.7% | 28.0% |
| Gwent Police | 3,611 | 27.6% | 37.1% | 27.9% |
| Avon and Somerset Constabulary | 8,654 | 27.4% | 35.3% | 27.7% |
| Dorset Police | 3,404 | 27.2% | 34.9% | 27.6% |
| Staffordshire Police | 5,476 | 27.4% | 26.9% | 27.4% |
| Thames Valley Police | 10,646 | 27.2% | 23.3% | 27.0% |
| Bedfordshire Police | 3,436 | 27.0% | 26.3% | 27.0% |
| West Midlands Police | 15,178 | 26.4% | 33.5% | 26.8% |
| Dyfed-Powys Police | 2,635 | 26.2% | 35.0% | 26.6% |
| Wiltshire Police | 3,545 | 26.5% | 25.2% | 26.5% |
| Essex Police | 8,763 | 26.1% | 33.9% | 26.5% |
| Hertfordshire Constabulary | 4,492 | 25.8% | 32.7% | 26.3% |
| Kent Police | 9,328 | 25.7% | 30.9% | 26.0% |
| Metropolitan Police Service | 37,829 | 25.7% | 29.9% | 25.9% |
| Suffolk Constabulary | 4,072 | 26.0% | 24.8% | 25.9% |
| Sussex Police | 7,001 | 24.1% | 32.7% | 24.5% |
| Surrey Police | 4,067 | 24.2% | 28.6% | 24.4% |
| Warwickshire Police | 2,342 | 24.1% | 33.0% | 24.4% |
| West Mercia Police | 5,312 | 24.1% | 33.9% | 24.4% |
| Gloucestershire Constabulary | 2,797 | 23.4% | 37.9% | 23.9% |
Source: Proven reoffending statistics: July to September 2024 — geographical data (CSV) (Ministry of Justice, published 30 July 2026) · file
Areas with fewer than 500 people in the cohort are marked small: a few people change the rate a lot.