Youth justice in London
Children (aged 10 to 17) cautioned or sentenced, by Youth Justice Service area. Official YJB figures. No individuals.
courtday.uk
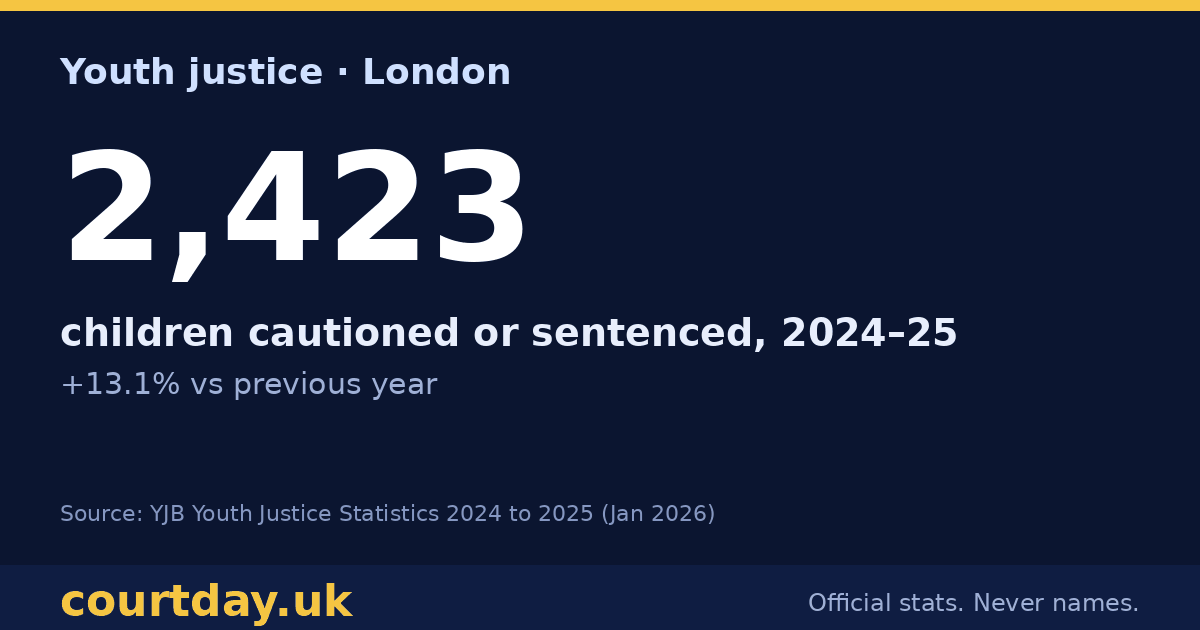
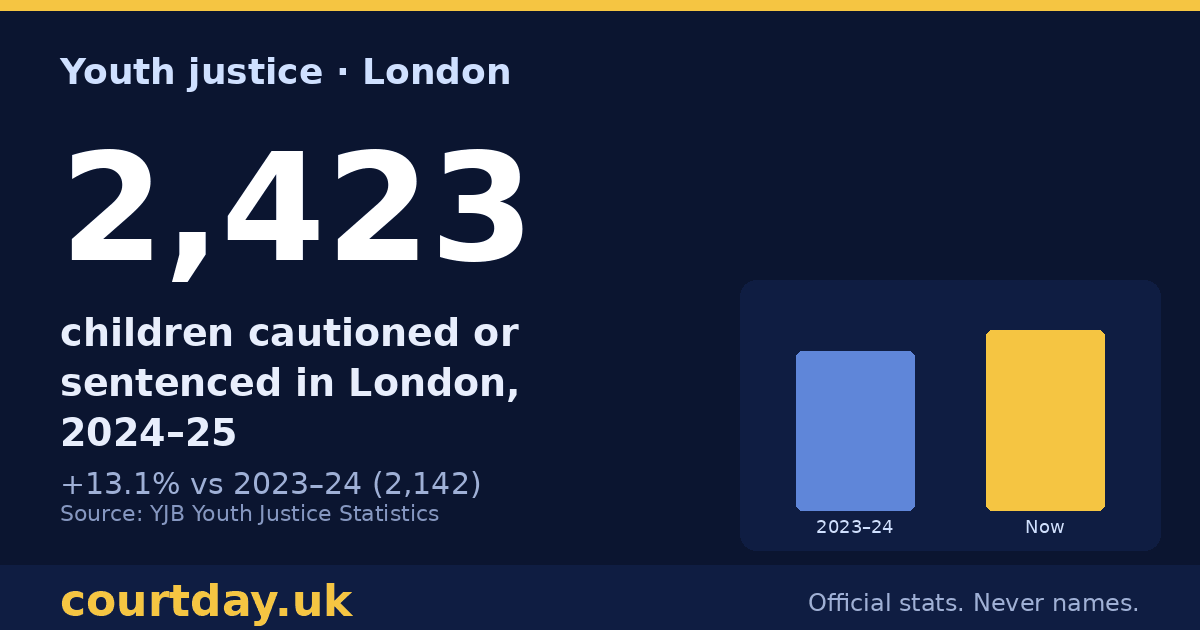
2,423
children cautioned or sentenced in London, 2024–25
+13.1% vs 2023–24 (2,142)
Source: Youth Justice Statistics: 2024 to 2025 — local level open data tables (Youth Justice Board for England and Wales, published 29 January 2026) · file
courtday.uk
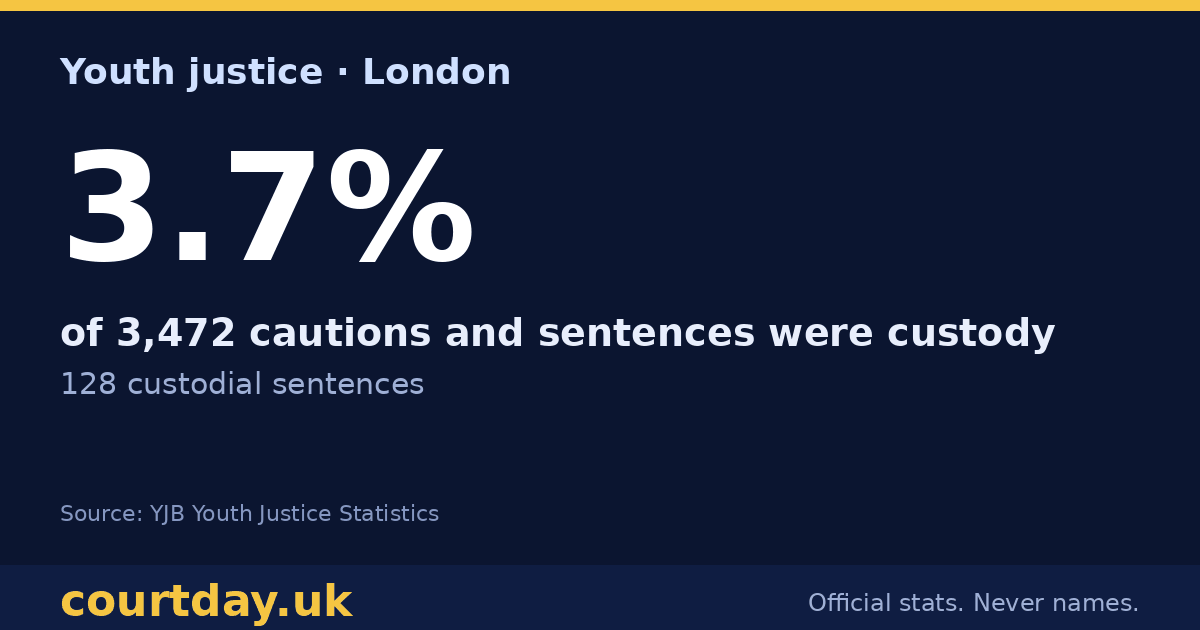
3.7%
of 3,472 cautions and sentences were custody
128 custodial sentences
Source: Youth Justice Statistics: 2024 to 2025 — local level open data tables (Youth Justice Board for England and Wales, published 29 January 2026) · file
Youth Justice Services in London
Tap the chart for a share image ↗ · figures in the table below
Not published (suppressed or caveated, not charted): Kensington and Chelsea, Sutton
| Youth Justice Service | Children 2023–24 | Children 2024–25 | Change | Cautions and sentences | Custody share |
|---|---|---|---|---|---|
| Greenwich | 88 | 170 | +93.2% | 226 | 0.9% |
| Croydon | 126 | 152 | +20.6% | 248 | 4.4% |
| Enfield | 105 | 130 | +23.8% | 194 | 3.1% |
| Lewisham | 92 | 111 | +20.7% | 162 | 3.7% |
| Lambeth | 112 | 107 | -4.5% | 142 | 0.7% |
| Barking and Dagenham | 107 | 101 | -5.6% | 142 | 6.3% |
| Brent | 81 | 100 | +23.5% | 138 | 1.4% |
| Waltham Forest | 94 | 99 | +5.3% | 139 | 1.4% |
| Barnet | 66 | 98 | +48.5% | 173 | 0.6% |
| Hackney | 89 | 97 | +9.0% | 166 | 7.8% |
| Newham | 104 | 97 | -6.7% | 138 | 3.6% |
| Haringey | 82 | 91 | +11.0% | 135 | 0.7% |
| Hounslow | 51 | 75 | +47.1% | 119 | 2.5% |
| Southwark | 94 | 75 | -20.2% | 112 | 3.6% |
| Redbridge | 85 | 74 | -12.9% | 99 | 7.1% |
| Ealing | 58 | 73 | +25.9% | 99 | 2.0% |
| Tower Hamlets and City of London | 61 | 69 | +13.1% | 113 | 15.0% |
| Bexley | 63 | 66 | +4.8% | 76 | 2.6% |
| Westminster | 35 | 66 | not shown (small) | 95 | 7.4% |
| Bromley | 46 | 65 | not shown (small) | 75 | 0.0% |
| Hillingdon | 75 | 61 | -18.7% | 83 | 4.8% |
| Camden | 49 | 59 | not shown (small) | 86 | 4.7% |
| Wandsworth | 49 | 58 | not shown (small) | 72 | 1.4% |
| Islington | 50 | 51 | +2.0% | 63 | 4.8% |
| Hammersmith and Fulham | 38 | 49 | not shown (small) | 58 | 8.6% |
| Harrow | 56 | 46 | not shown (small) | 61 | 8.2% |
| Havering | 59 | 45 | not shown (small) | 63 | 3.2% |
| Kingston and Richmond | 40 | 38 | not shown (small) | 54 | 1.9% |
| Merton | 30 | 38 | not shown (small) | 66 | 1.5% |
| Kensington and Chelsea | 17 | 34 | not shown (small) | 41 | not shown (small) |
| Sutton | 40 | 28 | not shown (small) | 34 | not shown (small) |
Source: Youth Justice Statistics: 2024 to 2025 — local level open data tables (Youth Justice Board for England and Wales, published 29 January 2026) · file
Counts are unrounded figures from the YJB local level tables. Changes and custody shares are not shown where a service had fewer than 50 children or outcomes, because a few cases move them a lot. Children are aged 10 to 17. A child is counted once per year in each service area.
Trend, 2014–15 to 2024–25
Tap the chart for a share image ↗ · figures in the table below
| Year | Children cautioned or sentenced, London |
|---|---|
| 2014–15 | 5,892 |
| 2015–16 | 5,711 |
| 2016–17 | 5,359 |
| 2017–18 | 5,396 |
| 2018–19 | 4,227 |
| 2019–20 | 3,902 |
| 2020–21 | 3,139 |
| 2021–22 | 2,711 |
| 2022–23 | 2,340 |
| 2023–24 | 2,142 |
| 2024–25 | 2,423 |
Source: Youth Justice Statistics: 2024 to 2025 — local level open data tables (Youth Justice Board for England and Wales, published 29 January 2026) · file
See also: all regions · police forces · reoffending