CPS Area performance
How each of the Crown Prosecution Service's 14 Areas performed in April 2025 to March 2026 (Q1–Q4 2025-26): charging decisions, conviction rates and how long cases take.
courtday.uk
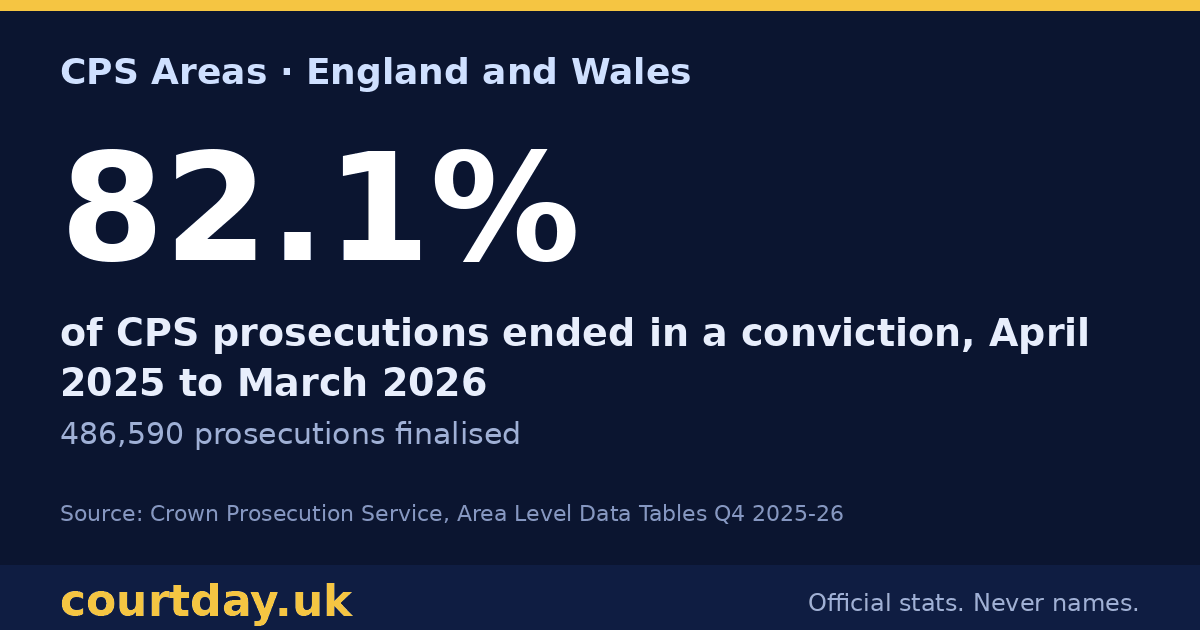
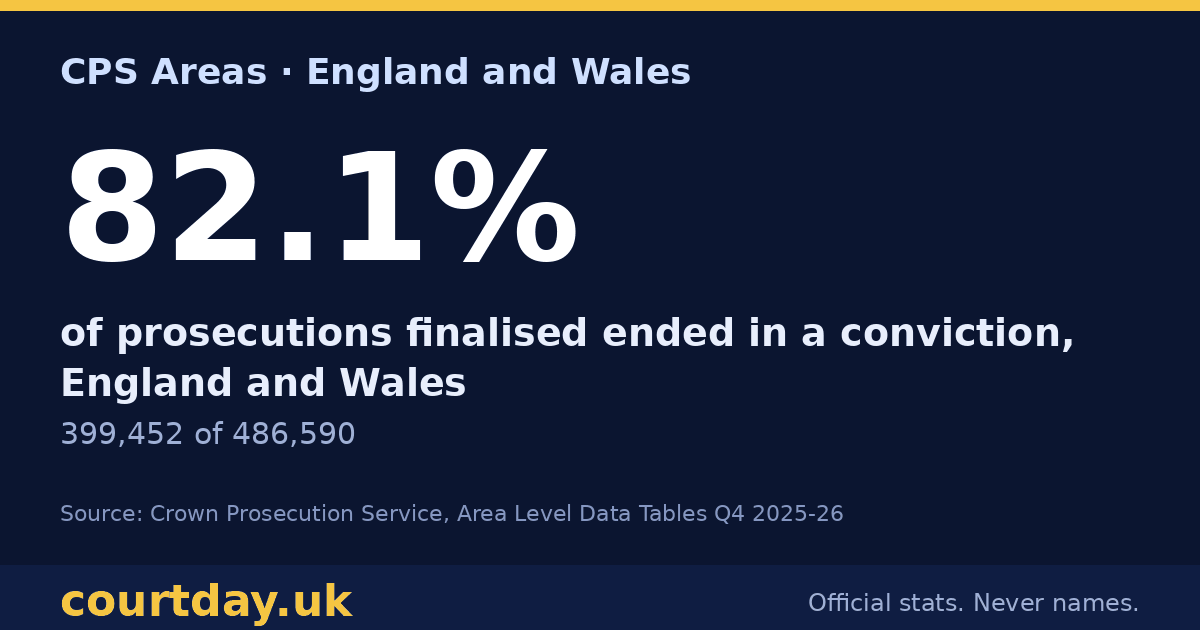
82.1%
of prosecutions finalised ended in a conviction, England and Wales
399,452 of 486,590
Source: CPS Area Level Data Tables Q4 2025-26 (xlsx) · Crown Prosecution Service, CPS data summary Q4 2025-26 · April 2025 to March 2026 (Q1–Q4 2025-26) · Open Government Licence v3.0
courtday.uk
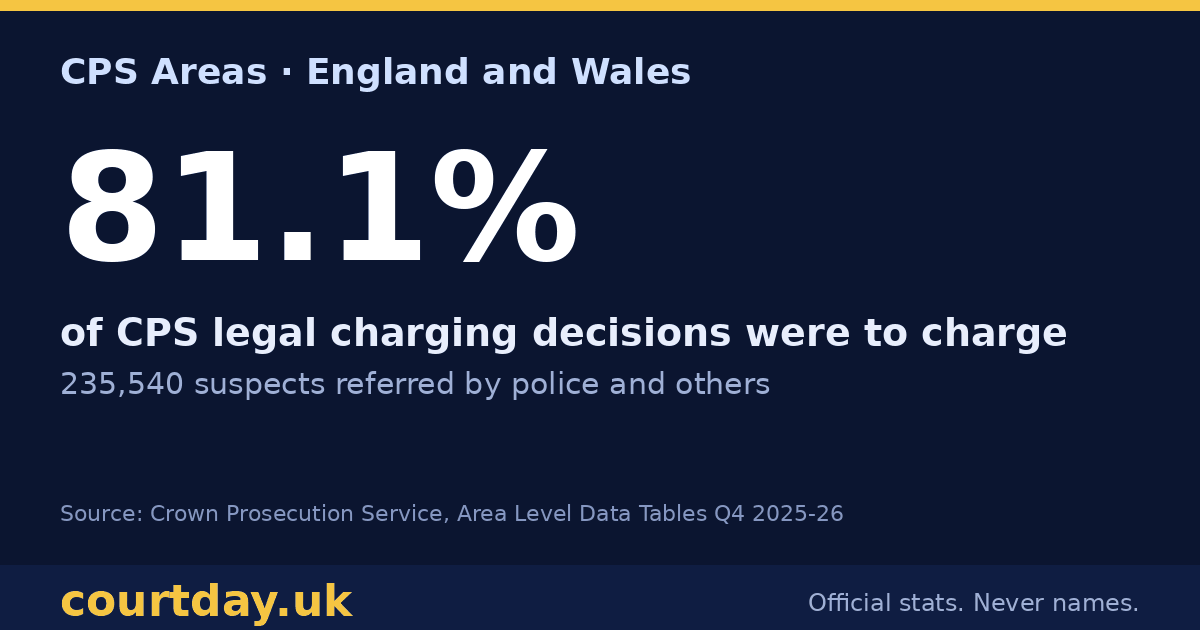
81.1%
of CPS legal charging decisions were to charge
235,540 suspects referred by police and others
Source: CPS Area Level Data Tables Q4 2025-26 (xlsx) · Crown Prosecution Service, CPS data summary Q4 2025-26 · April 2025 to March 2026 (Q1–Q4 2025-26) · Open Government Licence v3.0
courtday.uk
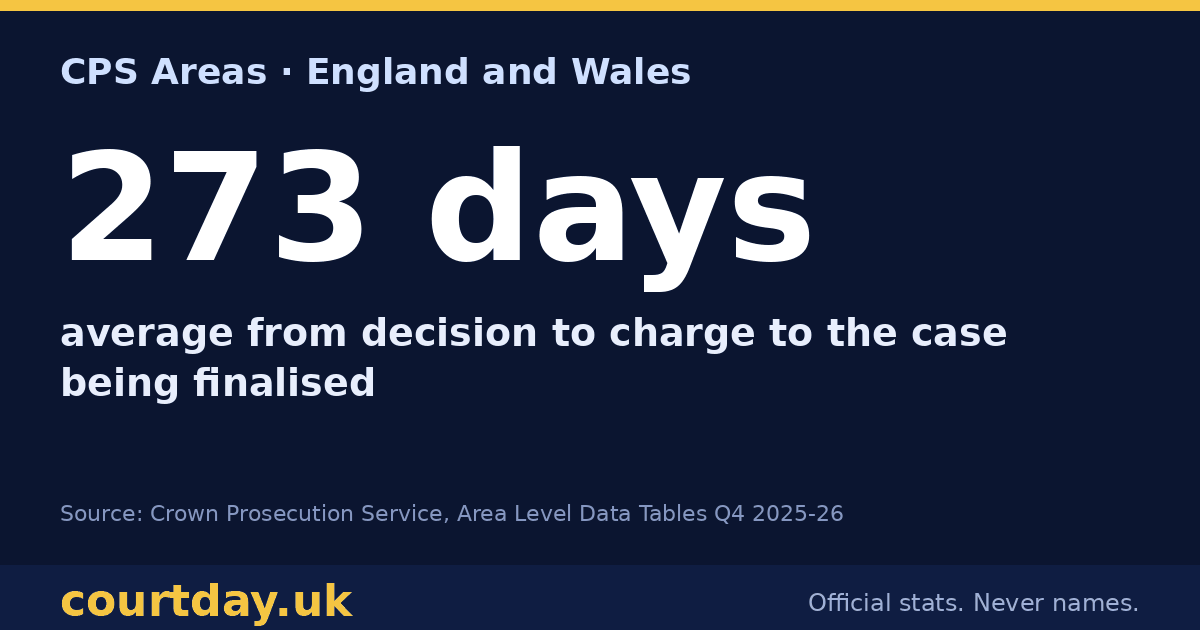
273 days
average from decision to charge to the case being finalised
Source: CPS Area Level Data Tables Q4 2025-26 (xlsx) · Crown Prosecution Service, CPS data summary Q4 2025-26 · April 2025 to March 2026 (Q1–Q4 2025-26) · Open Government Licence v3.0
Read with care. The CPS says these are management information from its case management system, not official statistics; figures are provisional. A CPS conviction rate counts cases the CPS finalised. It is a different measure from the MoJ conviction ratio on our offence pages. CPS Areas are not the same as court areas. Central Casework Divisions handle specialist national cases.
By CPS Area
Tap the chart for a share image ↗ · figures in the table below
| CPS Area | Prosecutions finalised | Conviction rate | Suspects referred for charging decision | Charged (of legal decisions) | Days referral to charge (avg) | Days charge to finalisation (avg) |
|---|---|---|---|---|---|---|
| Merseyside & Cheshire | 29,196 | 85.8% | 13,990 | 84.5% | 41 | 189 |
| South West | 23,807 | 85.6% | 10,473 | 83.1% | 47 | 247 |
| Wessex | 22,649 | 85.4% | 10,272 | 75.7% | 46 | 260 |
| East Midlands | 39,524 | 84.6% | 16,187 | 82.1% | 40 | 268 |
| Cymru Wales | 29,991 | 84.3% | 14,563 | 77.6% | 47 | 167 |
| East of England | 31,822 | 84.1% | 15,695 | 78.4% | 43 | 320 |
| North East | 28,239 | 83.7% | 12,213 | 78.7% | 40 | 222 |
| South East | 32,359 | 83.2% | 15,206 | 83.5% | 30 | 381 |
| North West | 49,059 | 83.1% | 25,073 | 81.7% | 29 | 270 |
| Yorkshire & Humberside | 50,651 | 82.4% | 23,625 | 80.7% | 47 | 229 |
| Thames and Chiltern | 26,068 | 82.2% | 11,106 | 83.9% | 47 | 303 |
| West Midlands | 50,694 | 77.9% | 27,807 | 78.5% | 41 | 293 |
| London North | 37,768 | 76.8% | 18,844 | 83.1% | 30 | 295 |
| Central Casework Divisions | 1,059 | 75.7% | 3,540 | 73.0% | 384 | 1084 |
| London South | 33,704 | 75.4% | 16,946 | 85.6% | 63 | 298 |
Source: CPS Area Level Data Tables Q4 2025-26 (xlsx) · Crown Prosecution Service, CPS data summary Q4 2025-26 · April 2025 to March 2026 (Q1–Q4 2025-26) · Open Government Licence v3.0
By police force
Cases are counted against the police force that referred them; CPS notes these will not sum to Area figures.
Tap the chart for a share image ↗ · figures in the table below
Source: CPS Area Level Data Tables Q4 2025-26 (xlsx) · Crown Prosecution Service, CPS data summary Q4 2025-26 · April 2025 to March 2026 (Q1–Q4 2025-26) · Open Government Licence v3.0
Terms: charge · how a case works.